Prometheus 查询语法手册
目录
常用查询
按时间段聚合指标数值
aggregation_over_time 系列函数用于聚合单个指标在过去一段时间的多个采样数值。比如计算某指标在过去5分钟内采样数值的平均值。先用 [5m] 取 5 分钟内地采样数组,然后用 avg_over_time 计算平均值:
avg_over_time(kube_pod_status_phase{cluster="abcd",phase="Pending"}[5m]
统计查询到的指标的数量
aggregation operators 系列操作符号,对查询出来的指标进行计算。count 统计查询到指标的数量。这些操作支持按 lable 聚合,用 by 指定。比如下面的语句统计位于不同 phase 状态的指标数量。注意这些聚合的是多个指标,而不是单个指标的多个采样数据,和 aggrXX_over_time 系列函数区分开。
count(kube_pod_status_phase{cluster="abcd"}) by(phase)
查询持续处于 pending 状态的 pod
kubernetes 的指标 kube_pod_status_phase 反应 pod 是否处于指定的 phase 状态,1 表示是,0 表是否。找出过去 5min 一直处于 pending 状态的 pod。立即在过去 5min 中里的 Pending 的采样数值都是 1 的 pod:
avg_over_time(kube_pod_status_phase{phase="Pending"}[5m]) == 1
计算这些 Pod 的占比,按照 cluster 区分:
sum(avg_over_time(kube_pod_status_phase{phase="Pending"}[5m])==1) by (cluster)
/
count(avg_over_time(kube_pod_status_phase{phase="Pending"}[5m])) by (cluster)
安装配置
从 prometheus download 下载已经编译好的 prometheus 程序,该页面上还有 prometheus 提供的 exporter。
命令行参数
Prometheus 的命令行参数不是特别多,比较重要的有:
- –config.file 指定配置文件
- –log.level 日志级别
- –web.listen-address 监听地址
- –web.read-timeout 访问超时时间
- –web.enable-admin-api 启用 admin api
- –web.external-url 访问地址
- –query.max-concurrency 远程调用并发上限
- –storage.tsdb.path 指定数据文件存放目录
- –storage.tsdb.retention.time 设置数据保留期限,例如 15d
- –storage.remote.read-concurrent-limit 读取并发连接数上限
配置文件 prometheus.yml 中主要包含告警规则文件、静态配置的采集地址或者动态发现采集地址的方法。
配置文件格式
配置文件是 yaml 格式的,分为 global、alerting、rule_files 和 scrape_configs 四部分。
global 是全局参数配置,alerting 是告警服务地址,rule_files 是告警和记录规则,scrape_configs 是数据采集地址。其中 rule_files 和 scrape_configs 是重点,后者支持多种动态发现方式,更复杂一些。
global:
  scrape_interval:     15s # Set the scrape interval to every 15 seconds. Default is every 1 minute.
  evaluation_interval: 15s # Evaluate rules every 15 seconds. The default is every 1 minute.
  # scrape_timeout is set to the global default (10s).

# Alertmanager configuration
alerting:
  alertmanagers:
  - static_configs:
    - targets:
      # - alertmanager:9093

# Load rules once and periodically evaluate them according to the global 'evaluation_interval'.
rule_files:
  # - "first_rules.yml"
  # - "second_rules.yml"

# A scrape configuration containing exactly one endpoint to scrape:
# Here it's Prometheus itself.
scrape_configs:
  # The job name is added as a label `job=<job_name>` to any timeseries scraped from this config.
  - job_name: 'prometheus'

    # metrics_path defaults to '/metrics'
    # scheme defaults to 'http'.

    static_configs:
    - targets: ['localhost:9090']
配置文件检查
可以用 promtool 检查配置文件是否正确:
$ ./promtool check config prometheus.yml
Checking prometheus.yml
  SUCCESS: 0 rule files found
数据类型
Prometheus 存放的是每个指标的时间序列值,指标名由 Metric name 和 labels 组成 :
<metric name>{<label name>=<label value>, ...}
例如:
api_http_requests_total{method="POST", handler="/messages"}
指标类型
指标类型一共有 四种:
Counter:计数器,记录的是正向增长的累计值;
Gauge: 测量值,记录的是指标当前的状态数值;
Histogram: 直方图,就是统计学中的直方图,记录落在每个区间内的指标值的个数;
Summary: 分布图,就是统计学中的分布图,记录指标值的分位数。
生成代码
如果要生成 prometheus 样式的指标数据,可以用 prometheus 提供的 client sdk。go client 中的指标定义方法如下:
scheduleAttempts = prometheus.NewCounterVec(
    prometheus.CounterOpts{
        Subsystem: SchedulerSubsystem,
        Name:      "schedule_attempts_total",
        Help:      "Number of attempts to schedule pods, by the result. 'unschedulable' means a pod could not be scheduled, while 'error' means an internal scheduler problem.",
    }, []string{"result"})
// PodScheduleSuccesses counts how many pods were scheduled.
PodScheduleSuccesses = scheduleAttempts.With(prometheus.Labels{"result": "scheduled"})

PreemptionVictims = prometheus.NewGauge(
    prometheus.GaugeOpts{
        Subsystem: SchedulerSubsystem,
        Name:      "pod_preemption_victims",
        Help:      "Number of selected preemption victims",
    })

BindingLatency = prometheus.NewHistogram(
    prometheus.HistogramOpts{
        Subsystem: SchedulerSubsystem,
        Name:      "binding_duration_seconds",
        Help:      "Binding latency in seconds",
        Buckets:   prometheus.ExponentialBuckets(0.001, 2, 15),
    },
)

SchedulingLatency = prometheus.NewSummaryVec(
    prometheus.SummaryOpts{
        Subsystem: SchedulerSubsystem,
        Name:      SchedulingLatencyName,
        Help:      "Scheduling latency in seconds split by sub-parts of the scheduling operation",
        // Make the sliding window of 5h.
        // TODO: The value for this should be based on some SLI definition (long term).
        MaxAge: 5 * time.Hour,
    },
    []string{OperationLabel},
)
查询语句基本语法
Prometheus 的数据查询语句叫做 Prometheus Query Language,提供了不少查询函数,表达能力比较丰富。 语句的执行结果有四种类型:
- Scalar: 浮点数值
- String: 字符串(预留类型,当前没有实现 2019-08-07 18:04:55)
- Instant vector:当前数值,每个时间戳对应一个数值
- Range vector: 区间数值, 每个时间戳对应一个数组
Instant vector:
Range vector
Range Vector 的用途可以参考 Understanding Prometheus Range Vectors,简单来说为了支持对区间内的数值进行运算,比如计算增量、方差等等。
指标查询
Prometheus 的指标查询语句基本格式为:
指标名称{ 标签名=<数值> }
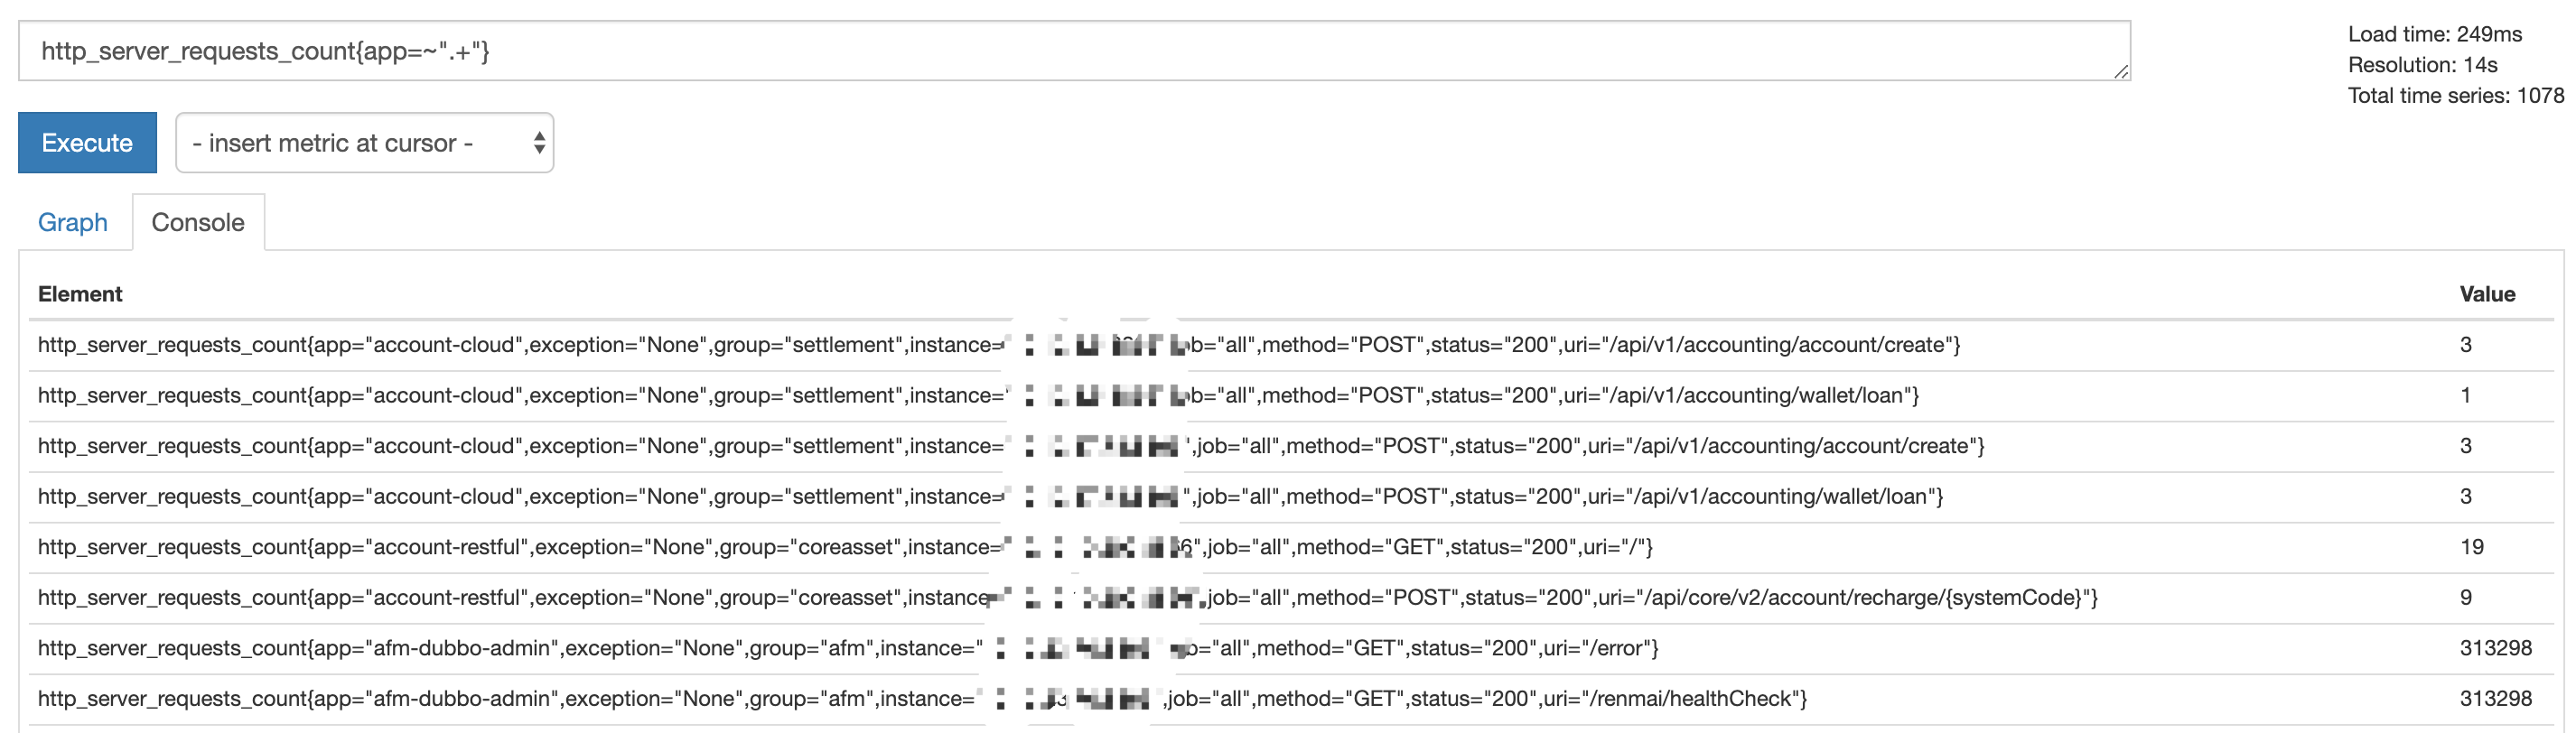
以 http_server_requests_count 为例,指标上带有 label,通过 label 区分不同来源的数据。
查询 method 为 POST,status 为 200 的采集数据:
http_server_requests_count{method="POST",status="200"}
标签条件支持 =、!=、=~(正则匹配)。
默认查询的是当前时间的数据,如果要查询过去的数据,使用 offset,例如查询 5 分钟前的数据:
http_server_requests_count{method="POST",status="200"} offset 5m
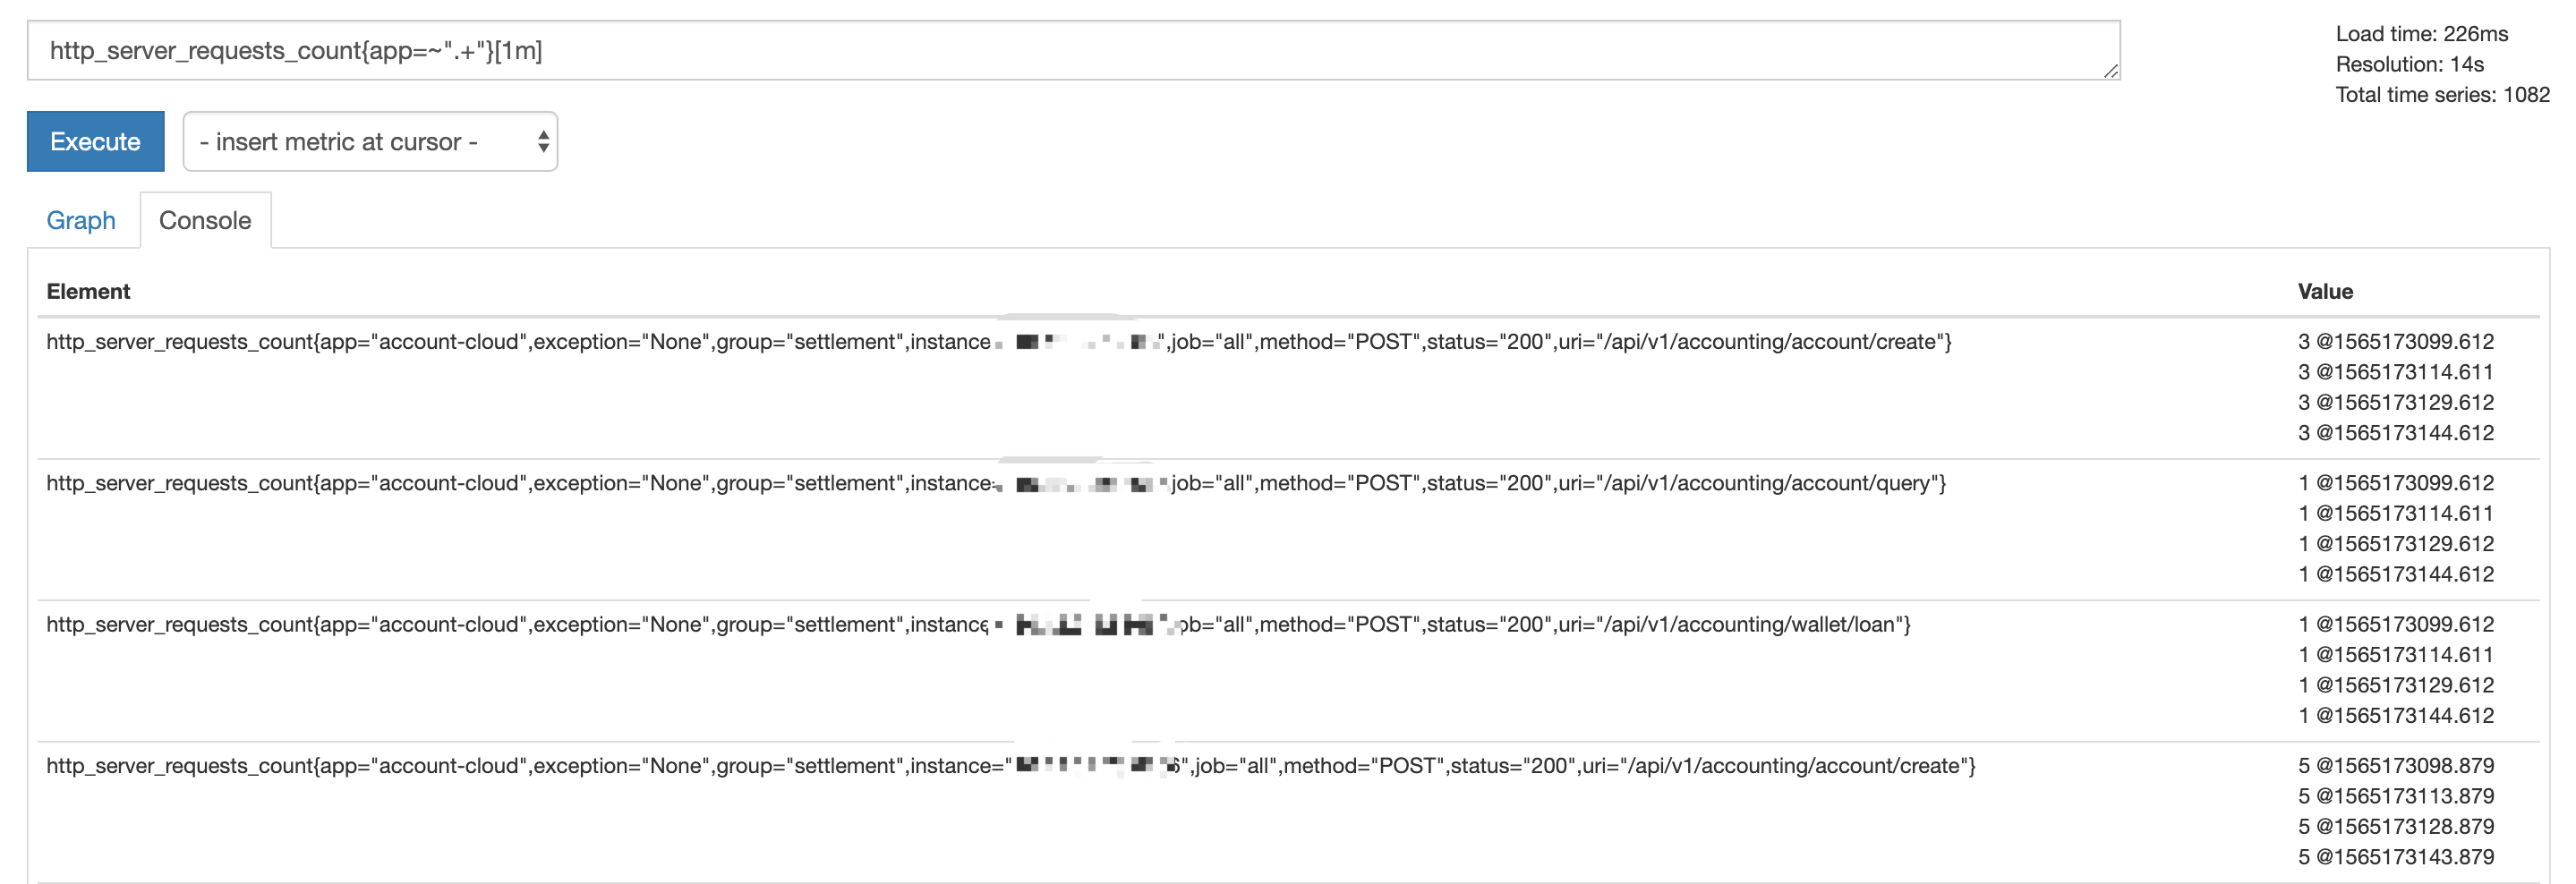
要查询指标在某一区间的数值,使用 [],[] 中是从当前时间相对于相对于 offet向前推的时间段,例如查询 5 分钟前的 1 分钟区间里的数据:
http_server_requests_count{method="POST",status="200"}[1m] offset 5m
查询结果运算
Prometheus 的查询语句支持运算,可以使用二元运算符(算术运算符、比较运算符、集合运算符)和聚合运算符直接操作查询出来的数据集,也可以使用 Prometheus 提供的查询函数进行更复杂的运算。
运算符操作的对象主要是 Instant vector、Scalar 类型。操作对象中存在 Instant vector 时,需要知道数组成员如何配对。
vector 配对问题
操作数是两个 vector 时,vector 之间的配对关系可以是 1:1、1:N、N:1。
1:1,左边 vector 中数据 与 右边 vector 中拥有相同 label 的数据配对,可以用 ignoring 忽略部分 label,或者用 on 指定配对使用的 label,用法如下:
<vector expr> <bin-op> ignoring(<label list>) <vector expr>
<vector expr> <bin-op> on(<label list>) <vector expr>
1:N,N:1,group_left 表示右边 vector 中的一个成员会匹配左边的 vector 中的多个成员,group_right 反过来,左边 vector 中的一个成员会匹配右边的 vector 中的多个成员,group 指定的是 N。ignoring 和 on 分别用于删减用于匹配的 label 、指定用于匹配的 label:
<vector expr> <bin-op> ignoring(<label list>) group_left(<label list>) <vector expr>
<vector expr> <bin-op> on(<label list>) group_left(<label list>) <vector expr>

<vector expr> <bin-op> ignoring(<label list>) group_right(<label list>) <vector expr>
<vector expr> <bin-op> on(<label list>) group_right(<label list>) <vector expr>
vector 配对示例
假设 Prometheus 中存放下面两个指标数据:
method_code:http_errors:rate5m{method="get", code="500"}  24
method_code:http_errors:rate5m{method="get", code="404"}  30
method_code:http_errors:rate5m{method="put", code="501"}  3
method_code:http_errors:rate5m{method="post", code="500"} 6
method_code:http_errors:rate5m{method="post", code="404"} 21

method:http_requests:rate5m{method="get"}  600
method:http_requests:rate5m{method="del"}  34
method:http_requests:rate5m{method="post"} 120
1:1 配对,计算每个方法中 500 错误的占比,因为 method:http_requests:rate5m 没有名为 code 的 label,所以用 ignoring 忽略 code,只剩下 method label 用于配对 :
method_code:http_errors:rate5m{code="500"} / ignoring(code) method:http_requests:rate5m
结果如下:
{method="get"}  0.04            //  24 / 600
{method="post"} 0.05            //   6 / 120
N:1 配对,计算每个方法中所有错误码的占比,多个错误代码对应一类请求:
method_code:http_errors:rate5m / ignoring(code) group_left method:http_requests:rate5m
结果如下:
{method="get", code="500"}  0.04            //  24 / 600
{method="get", code="404"}  0.05            //  30 / 600
{method="post", code="500"} 0.05            //   6 / 120
{method="post", code="404"} 0.175           //  21 / 120
二元运算
两组查询出来的数据集之间的运算。
算术运算符
算术运算符支持:
+、-、*、/(除法)、%(取模)、^(指数)。
比较运算符
比较运算符支持:
==、!=、>、<、>=、<=
集合运算符
集合运算符支持:
and(交集)、or(并集)、unless(差集)
集合运算符需要特别说明一下,vector1 and vector2 的意思从 vector1 中取出满足 vetctor2 筛选条件的指标,例如下面的表达式:
http_server_requests_count{status="200"} and http_server_requests_count{method="POST",instance="10.12.3.5:8866"}
等同于:
http_server_requests_count{status="200",method="POST",instance="10.12.3.5:8866"}
vector1 or vector2 是取出 vector1 的所有成员 和 vector2 中不满足 vector1 的筛选条件的成员。
## 结果中包含所有满足 method="POST" 的数据,如果重复选择 or 之前的数据。
http_server_requests_count{status="200",instance="10.12.3.5:8866"} or http_server_requests_count{method="POST"}
vector1 unless vector2 取出不满足 vector2 筛选条件的所有 vector1 的成员:
http_server_requests_count{status="200",instance="10.12.3.5:8866"} unless http_server_requests_count{method="POST"}
等同于:
http_server_requests_count{status="200",instance="10.12.3.5:8866",method!="POST"}
聚合运算
聚合运算符形态上与函数类似,用于分析查询得到的数据集。
<aggr-op>([parameter,] <vector expression>) [without|by (<label list>)]
部分聚合运算符需要输入参数(parameter),例如 count_values、bottomk、topk 、quantile。支持分组聚合,分组聚合时,可以用 without 忽略指定的 label,或者 by 指定分组使用的 label:
sum:    求和
min:    最小值
max:    最大值
avg:    平均值
stddev: 平方差(stdvar的平方根)
stdvar: 方差
count:  计数
count_values: 统计每个值出现的次数
bottomk: 取结果中最小的 k 位数
topk:    取结果中最大的 k 位数
quantile: 取分位数 (0 ≤ φ ≤ 1)
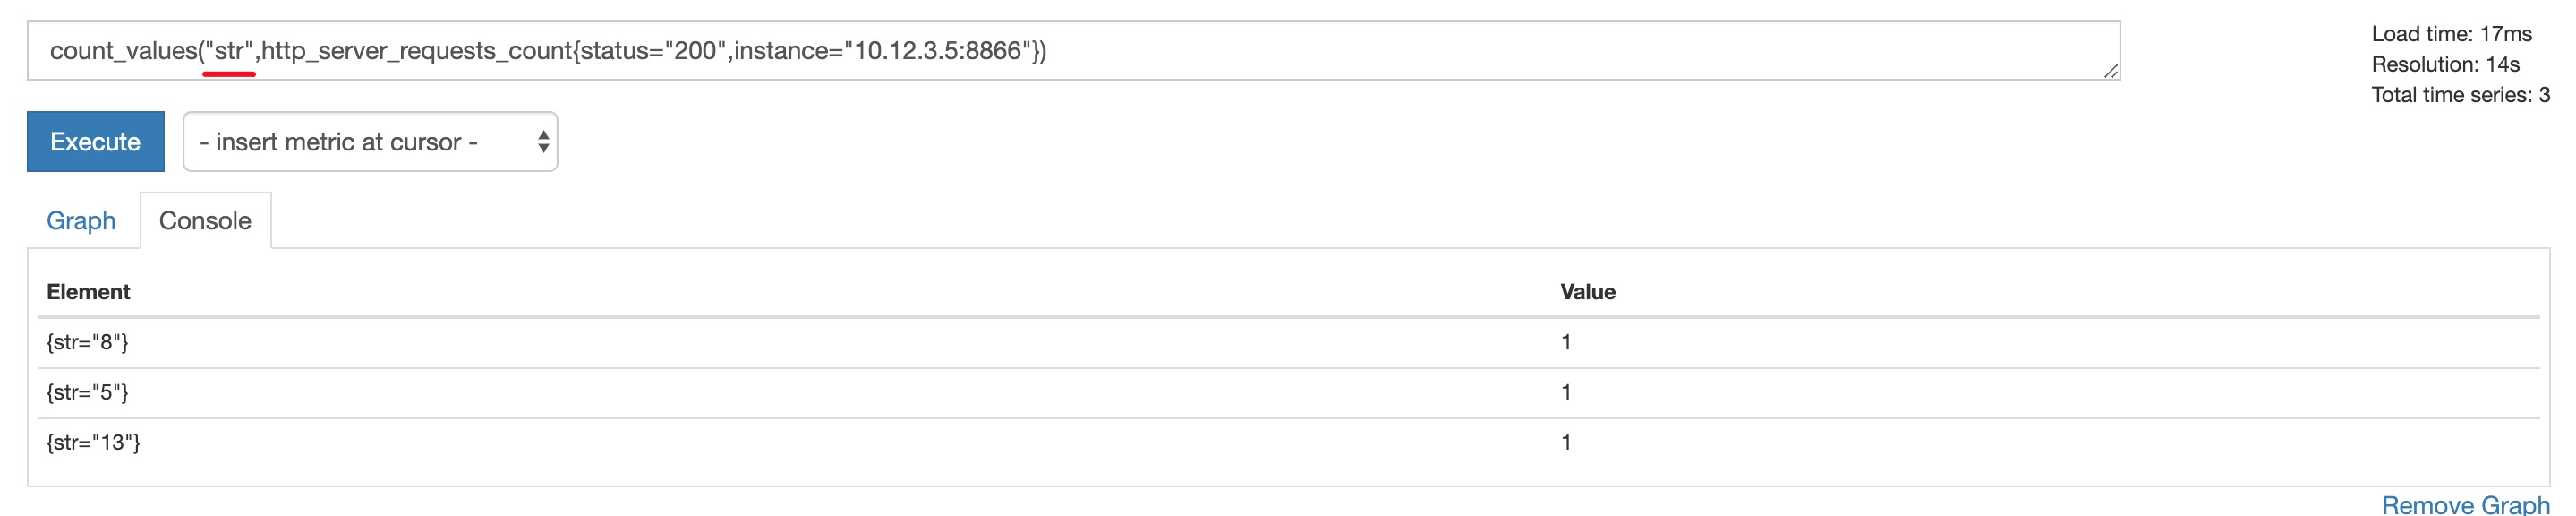
统计每个值出现的次数
统计每个值出现的次数,参数为结果中的字符串名称:
count_values("str",http_server_requests_count{status="200",instance="10.12.3.5:8866"})
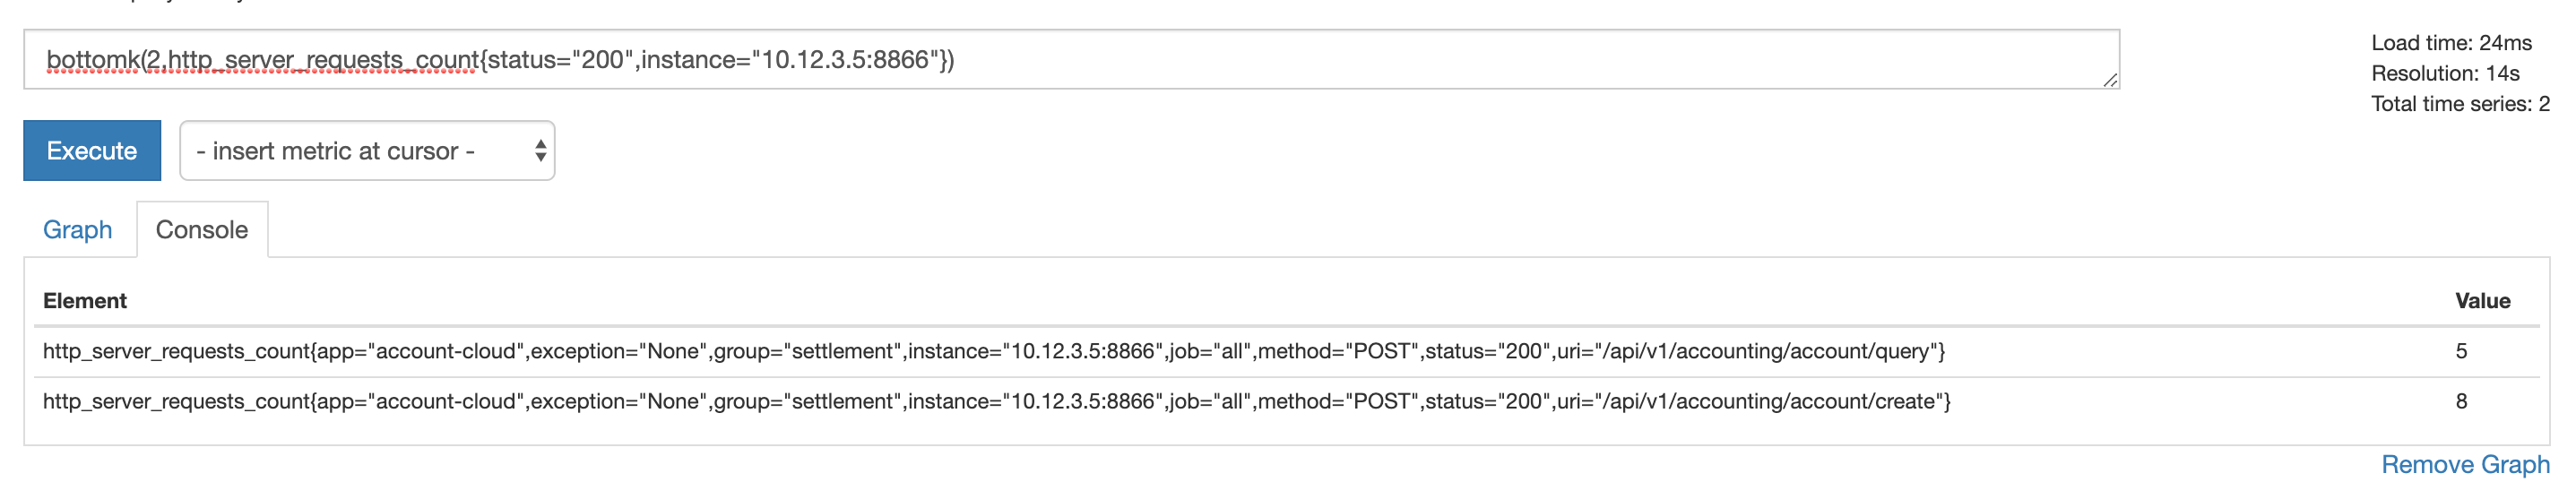
取前 k 位/后 k 位
取结果中最小(bottomk)和最大(topk)的 k 位数,参数为 k:
bottomk(2,http_server_requests_count{status="200",instance="10.12.3.5:8866"})
topk(2,http_server_requests_count{status="200",instance="10.12.3.5:8866"})
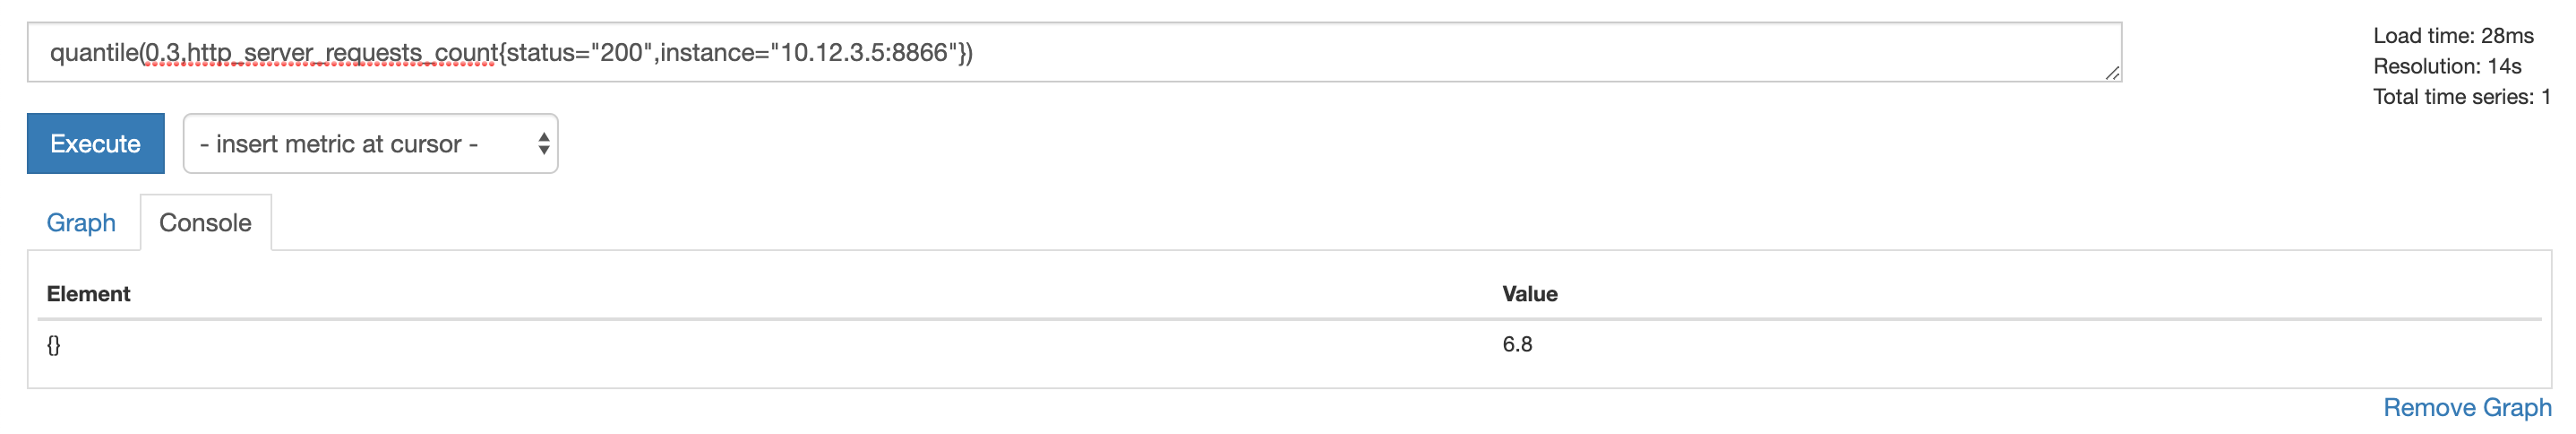
取分位数
取第 0.3 分位数,输入参数为分位位置:
quantile(0.3,http_server_requests_count{status="200",instance="10.12.3.5:8866"})
查询处理函数
Prometheus 的函数数量比较多,这里不罗列了,见 Prometheus Functions。
以后逐渐把不是特别好理解的函数的用法整理到这里。
区间数组
区间数组(range-vector)是过去一段时间内的多个数值,数值(scalar)。
aggregation_over_time() – 区间内聚合运算
这一组函数有多个,分别计算区间数组中的数据的平均值、最小值、最大值等:
形态:
avg_over_time(range-vector)
min_over_time(range-vector)
max_over_time(range-vector)
sum_over_time(range-vector)
count_over_time(range-vector)
quantile_over_time(scalar, range-vector)
stddev_over_time(range-vector)
stdvar_over_time(range-vector)
holt_winters() – 平滑数值
形态:holt_winters(v range-vector, sf scalar, tf scalar)
根据区间数组中的数据计算下一个平滑值,sf 是历史数值的权重,tf 是最新数值的权重,sf 和 tf 的取值范围为 [0,1]。
increase()
形态:increase(v range-vector)
计算区间数组中的增加值。
idelta()
形态:idelta(v range-vector)
返回区间数组中最新的两个数值的差值。
irate()、rate()
形态:irate(v range-vector)
用区间数组中最新的两个数值计算每秒变化。
形态:rate(v range-vector)
用区间数组中的数值计算每秒变化。
resets()
形态:resets(v range-vector)
返回数组中被重置的计数器(counter)的数量。
changes() – 指定时间段内变化次数
形态:changes(v range-vector)
计算 range-vector(区间数组)中的数值变化的次数。
delta()
形态:delta(v range-vector)
计算区间数组中第一个数值与最后一个数值的差值。
deriv() – 线性回归
形态:deriv(v range-vector)
predict_linear()
形态:predict_linear(v range-vector, t scalar)
线性预测时长 t 之后的数值。
数组
数组(instant-vector)是同一时刻的多个数值,
abs() – 算绝对值
形态:abs(v instant-vector)
将数组中的数值转换成各自的绝对值。
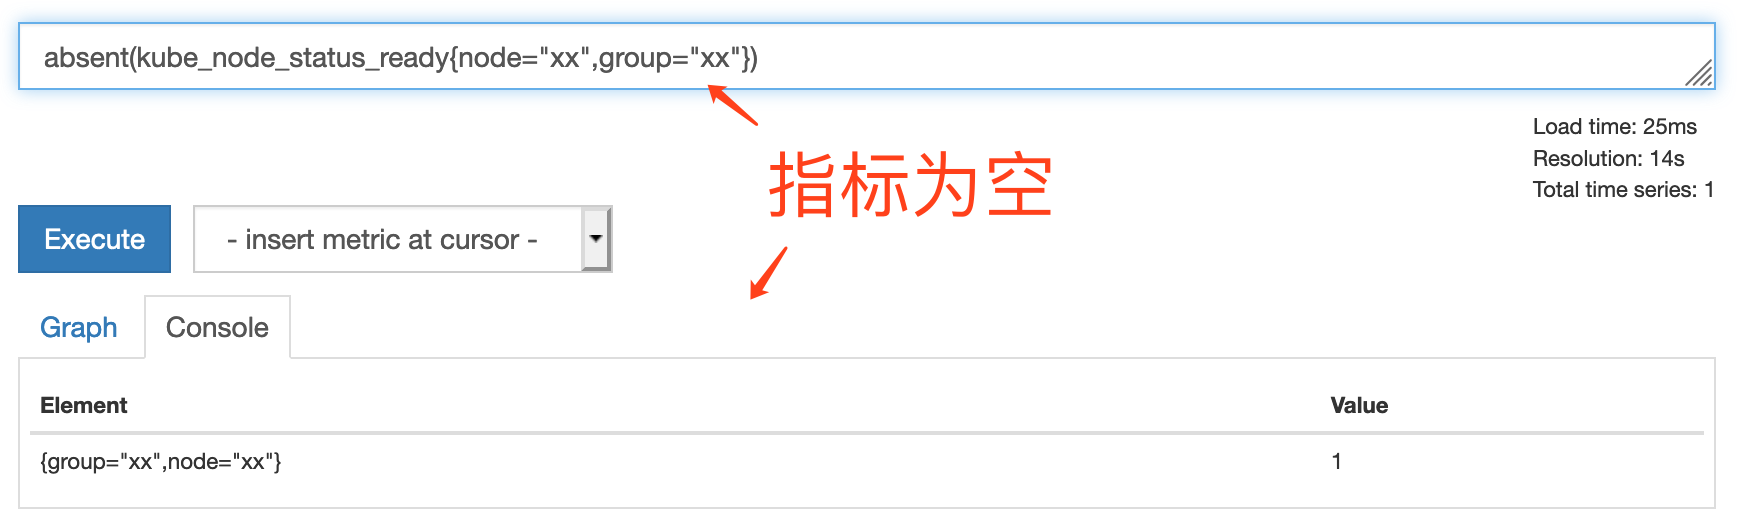
absent() – 缺值判断
形态:absent(v instant-vector)
如果指标为空,结果为 1,否则结果为空。例如下图中指标查询结果为空,absent 的结果是 1:
ceil() – 归整
形态:ceil(v instant-vector)
将数组中的数值转换成各自最接近的整数。
floor() – 向下归整
形态:floor(v instant-vector)
clamp_max() – 上限转换
形态:clamp_max(v instant-vector, max scalar)
将数组中超过上限的数值转换成上限值 max。
clamp_min() – 下限转换
形态:clamp_min(v instant-vector, min scalar)
将数组中低于下限的数值转换成下限值 min。
exp()
形态:exp(v instant-vector)
histogram_quantile() – 分位数
形态:histogram_quantile(φ float, b instant-vector)
返回数组中的 φ 分位数 [0,1]。
round()
形态:round(v instant-vector, to_nearest=1 scalar)
将数组中的数据向上归整,to_nearest 是归整步长。
The optional to_nearest argument allows specifying the nearest multiple to which the sample values should be rounded. This multiple may also be a fraction.
scalar()
形态:scalar(v instant-vector)
将只有一个成员的数组转换成数值。
sort()、sort_desc()
形态:sort(v instant-vector)、sort_desc(v instant-vector)
分别为升序、降序排列。
sqrt()
形态:sqrt(v instant-vector)
计算平方根。
label_join()
形态:label_join(v instant-vector, dst_label string, separator string, src_label_1 string, src_label_2 string, …)
将多个 src_label_XX 拼接成一个新的 dst_label,用分隔符 separator 连接。
label_replace()
形态:label_replace(v instant-vector, dst_label string, replacement string, src_label string, regex string)
用正则 regex 提取 src_label 中的字段,按照 replacement 形态拼接成 dst_label。
label_replace(up{job="api-server",service="a:c"}, "foo", "$1", "service", "(.*):.*")
ln()
形态:ln(v instant-vector)
计算数组中的数值的对数。
log2() 、log10()
形态:log2(v instant-vector)、log10(v instant-vector)
vector()
形态:vector(s scalar)
将数值转换成数组。
时间换算
day_of_month() – 月中位置
形态:day_of_month(v=vector(time()) instant-vector)
返回宿主中的时间位于月中第几天。
day_of_week() – 周中位置
形态:day_of_week(v=vector(time()) instant-vector)
返回宿主中的时间位于周中第几天。
days_in_month() – 月份天数
形态:days_in_month(v=vector(time()) instant-vector)
返回宿主中时间所在月份的天数。
year()
形态:year(v=vector(time()) instant-vector)
month()
形态:month(v=vector(time()) instant-vector)
hour()
形态:hour(v=vector(time()) instant-vector)
返回数组中时间位于当天的第几个小时。
minute()
形态:minute(v=vector(time()) instant-vector)
time()
形态:time()
返回当前的 UTC 时间(秒)
timestamp()
形态:timestamp(v instant-vector)
返回数组中数值对应的时间戳。
其它功能
参考