Prometheus 的 pushgateway 作用和用法
Prometheus 采集数据的方式是定时轮询,轮询的频率在配置文件中设置:
global:
  scrape_interval:     30s # Set the scrape interval to every 15 seconds. Default is every 1 minute.
  evaluation_interval: 30s # Evaluate rules every 15 seconds. The default is every 1 minute.
  # scrape_timeout is set to the global default (10s).
对于短时运行、不支持轮询的任务,可以引入 pushgateway,将指标数值以 push 的方式推送到 pushgateway暂存,然后 prometheus 从 pushgateway 中轮询。

运行 pushgateway
Docker 的安装方式见 Docker 安装部署。
用 docker 启动 pushgateway 是最方面的方式:
docker pull prom/pushgateway:v0.9.1
docker run -d -p 9091:9091 prom/pushgateway:v0.9.1
可以使用的镜像 tag 见 prom/pushgateway/tags,这里使用的是 v0.9.1。
# docker ps
CONTAINER ID    IMAGE                     COMMAND              CREATED        STATUS         PORTS                    NAMES
9fe07d8f549e    prom/pushgateway:v0.9.1   "/bin/pushgateway"   4 seconds ago  Up 2 seconds   0.0.0.0:9091->9091/tcp   sleepy_swanson
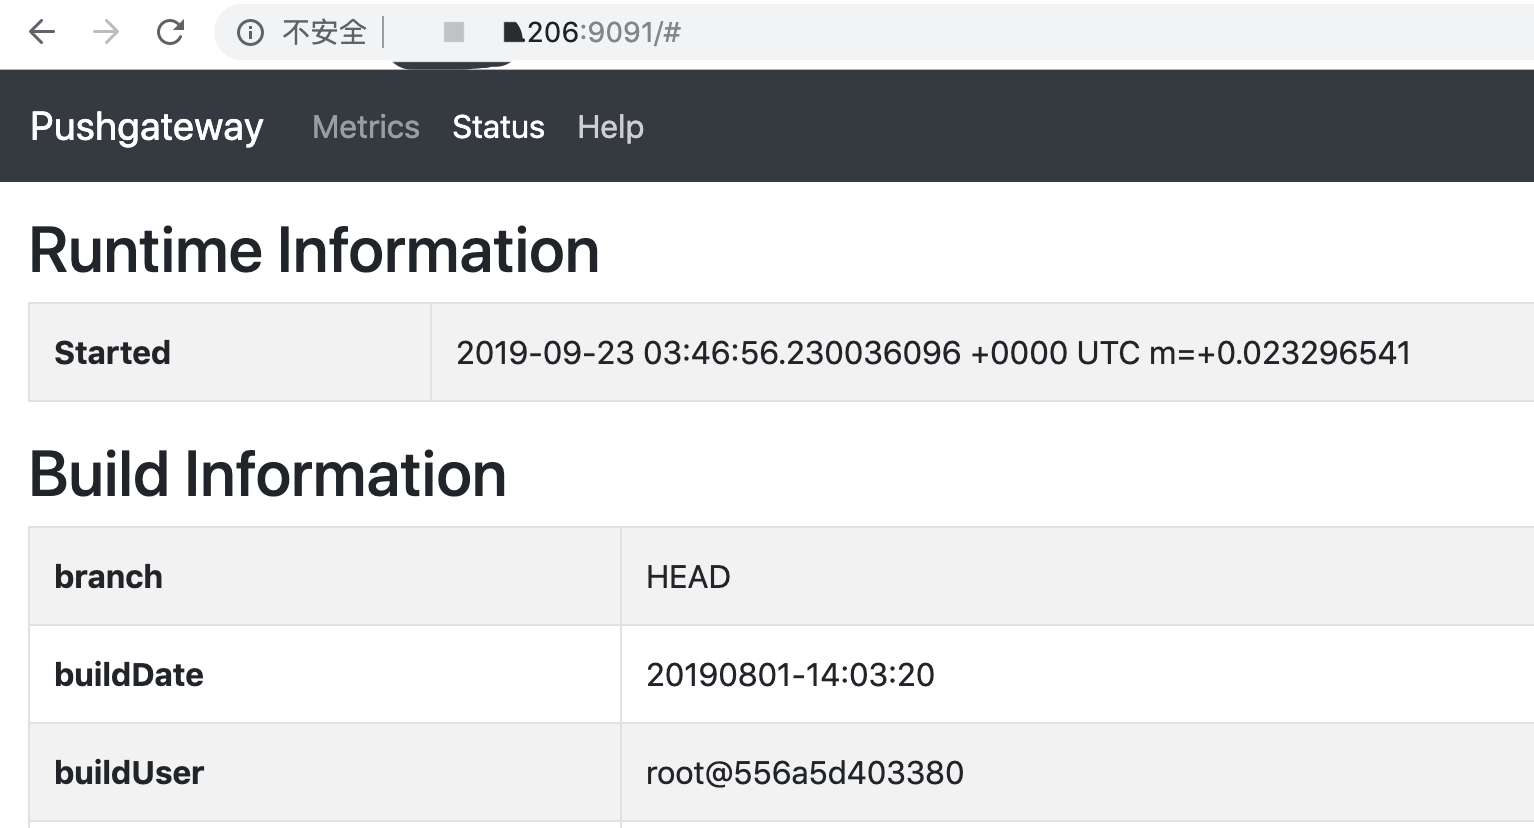
用浏览器打开 pushgateway 的页面,端口为 9901:
向 pushgateway 推送数据
推送数据的接口使用的是 http 协议,pushgateway api 中有说明。
用 curl 推送指标数值:
$ cat <<EOF | curl --data-binary @- http://127.0.0.1:9091/metrics/job/some_job/instance/some_instance
# TYPE some_metric counter
some_metric{label="val1"} 42
# TYPE another_metric gauge
# HELP another_metric Just an example.
another_metric 2398.283
EOF
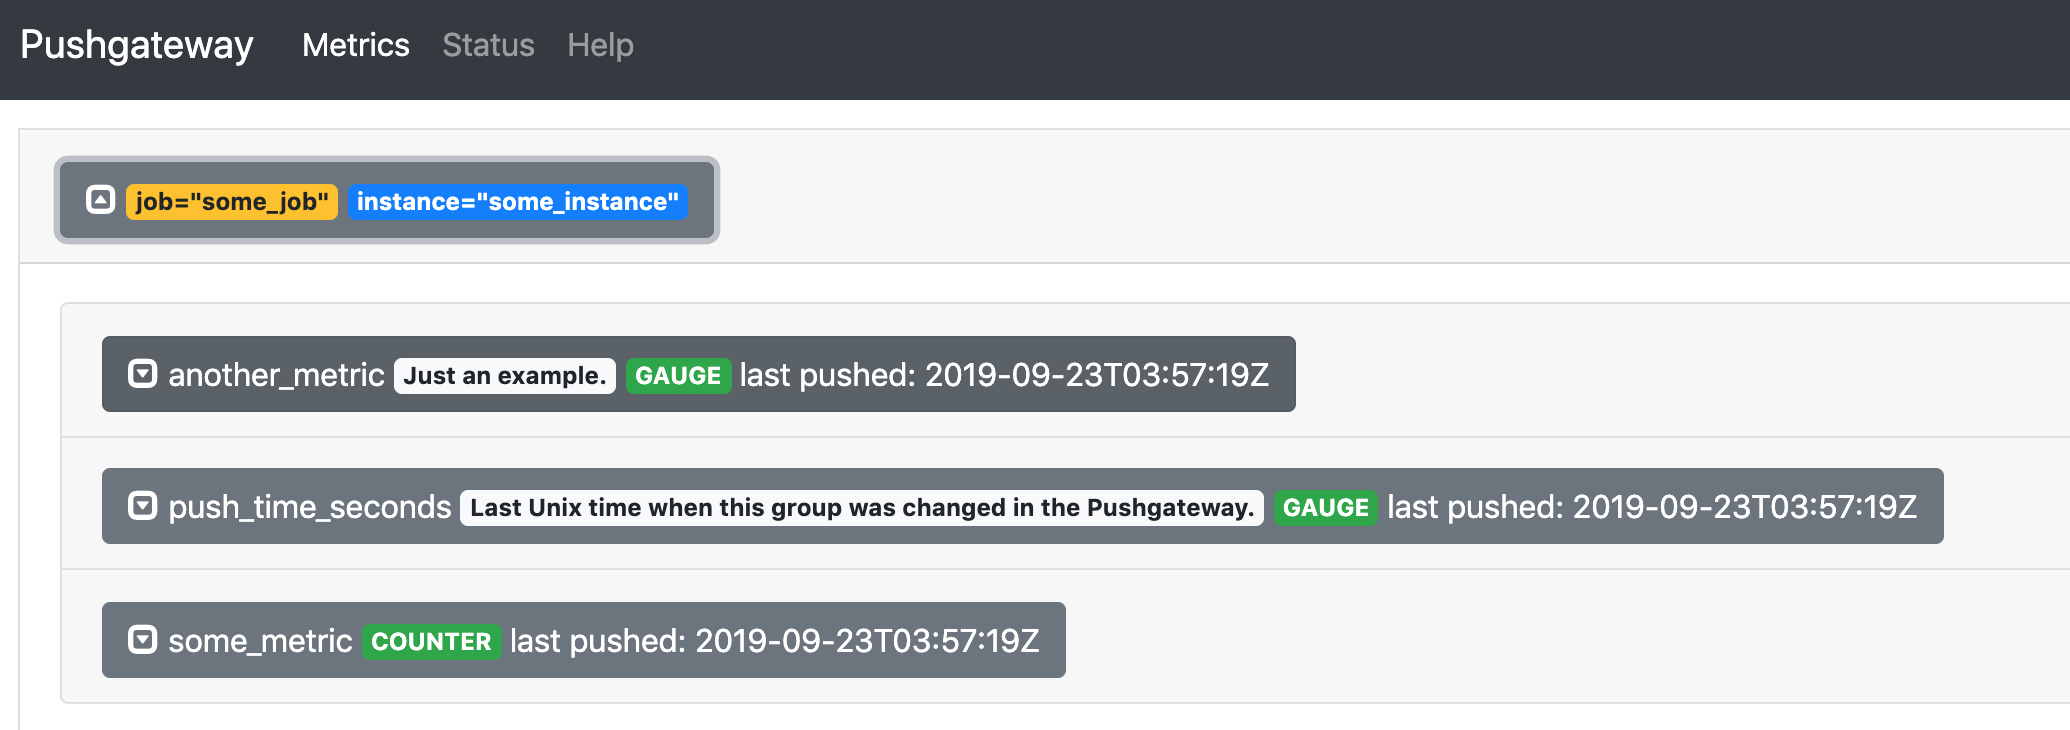
推送数据后,在页面中可以看到对应的 metrics:
用 Prometheus 采集 pushgateway 中指标数据
推送到 pushgateway 中的指标数据,通过 pushgateway 的 /metrics 接口获取:
$ curl http://127.0.0.1:9091/metrics |grep "some_"
push_time_seconds{instance="some_instance",job="some_job"} 1.5692110390599859e+09
# TYPE some_metric counter
some_metric{instance="some_instance",job="some_job",label="val1"} 42
可以看到 /metrics 接口返回的数据格式是 prometheus 支持的格式,因此用 prometheus 直接采集该接口的数据即可。
在 prometheus 中配置一个静态的 job,轮询 pushgateway 中的 /metrics:
scrape_configs:
  - job_name: "pushgateway"
    static_configs:
    - targets:
        - "127.0.0.1:9091/metrics"
      labels:
        pushgateway: "true"