怎样压测Web应用的性能?压测工具与测量、分析方法
目录
说明
最近在研究学习 kong 以及其它 api 网关,需要有一套测量方法,能够对不同网关的性能做出客观评估。
外部变量
最主要的外部变量是并发数,并发数量是一个可控的条件,要测量不同并发数下,单个请求的处理效率。
如果以并发数量为横轴,每个请求的处理效率为纵轴,可能会得到一个抛物线:随着并发数量增加,每个请求的处理效率越来越高,但当并发数量超过一个界值后,单个请求的处理效率开始平稳或者下降。
单个请求处理效率的测量
每个请求的处理效率如何测量是个问题。
最容易想到的测量指标是请求的平均响应时间,可以用每秒钟处理的请求数来度量,每秒钟处理的请求数量越多,平均处理时间越短,每秒钟处理的请求数直观反应了 Web 应用的处理能力。
只看平均数据是不够的,请求响应的平稳性也很重要。如果有的请求响应特别快,有的请求响应特别慢,即使平均响应时间很短,也不是一个好的结果,有时候可控、可预测比更好看的平均数字更重要。
平稳性可以通过请求响应时间的分布情况来度量。
请求的类型也需要关注,请求的类型不同,可能有一些不同的关注点:
- 响应型,请求后,立即响应,没有复杂的处理逻辑,传输的数据量也非常少,仅仅就是回应;
- 传输型,每次请求需要上传或者回应大量数据,Web服务器上的文件数量、被请求的文件的分布情况是重要的场景因素;
- 计算型,请求需要在后台进行一些计算,需要经过一段时间的CPU运算,才能返回字节数很少的结果;
传输型的请求,上下行带宽是重要的影响因素,计算型请求服务端的 CPU 处理能力。
并发效率的测量
Web 应用通常面对分布在天南海北的客户端,会瞬间涌入大量请求,因此并发效率也是非常重要的指标。
连接新建速率可以反映系统并发效率。
消耗的资源测量
如果两个 Web 应用每秒钟处理的请求相同、并发效率也接近,那么需要测量一下它们实际消耗的资源。
两个 Web 应用部署在同样规格的机器上,不等于它们消耗了同样的资源,可能有的 CPU 消耗的高,有的内存消耗的高。。
实际消耗的资源如果明显不同,有可能是实现机制上不同,遇到了不同的瓶颈。
压测工具
下面的文章介绍了几种常见的 BenchMark 测试工具:
- How to do Web Server Performance Benchmark in FREE?
- Modern HTTP Benchmarking Tools ready for 2018 – h2load, hey & wrk
对 Web 应用压测之前,先测试一下压测端与目标机器之间的带宽:iperf、netperf 等网络性能测试工具的使用。
jmeter
jmeter 是一个应用比较广泛的压测工具。
brew install jmeter
jmeter 有 CLI 模式和 GUI 模式,GUI 模式有图形界面,用来设置测试计划,在 mac 上用下面的方式启动:
cd /usr/local/Cellar/jmeter/5.1.1/libexec/bin
./jmeter.sh
wrk
建议使用 wrk,wrk 效率非常非常,可以用 10~20% 的cpu将目标机器上的多个 cpu 打满, 后面提到的 siege 则几乎是一个 cpu 只能打满对方一个 cpu,压测效率很低:
git clone https://github.com/wg/wrk.git
cd wrk
make
wrk使用方法如下:
$ ./wrk
Usage: wrk <options> <url>
  Options:
    -c, --connections <N>  Connections to keep open
    -d, --duration    <T>  Duration of test
    -t, --threads     <N>  Number of threads to use

    -s, --script      <S>  Load Lua script file
    -H, --header      <H>  Add header to request
        --latency          Print latency statistics
        --timeout     <T>  Socket/request timeout
    -v, --version          Print version details

  Numeric arguments may include a SI unit (1k, 1M, 1G)
  Time arguments may include a time unit (2s, 2m, 2h)
./wrk -t 32 -c 64 -d 60s -H "Host: webshell.com" http://172.16.129.4/ping
httperf
httperf 有几个其它压测工具不具备的功能:
- 以指定的速率新建连接发送请求或建立 Session;
- 支持 Session,即模拟用户习惯,请求不是连续发送的,而是发送一批请求,停顿一段时间,再发送一批。
在 Mac 上可以直接用 brew 安装 httperf:
brew install httperf
httperf 的参数比较多,可以翻阅 man httperf 查看:
Usage: httperf [-hdvV] [--add-header S] [--burst-length N] [--client N/N]
	[--close-with-reset] [--debug N] [--failure-status N]
	[--help] [--hog] [--http-version S] [--max-connections N]
	[--max-piped-calls N] [--method S] [--no-host-hdr]
	[--num-calls N] [--num-conns N] [--period [d|u|e]T1[,T2]]
	[--port N] [--print-reply [header|body]] [--print-request [header|body]]
	[--rate X] [--recv-buffer N] [--retry-on-failure] [--send-buffer N]
	[--server S] [--server-name S] [--session-cookies]
	[--ssl] [--ssl-ciphers L] [--ssl-no-reuse]
	[--think-timeout X] [--timeout X] [--uri S] [--verbose] [--version]
	[--wlog y|n,file] [--wsess N,N,X] [--wsesslog N,X,file]
	[--wset N,X]
--print-reply=header 显示响应头。
如果出现下面的提示,需要修改 ulimit -n :
httperf: warning: open file limit > FD_SETSIZE; limiting max. # of open files to FD_SETSIZE
源码编译安装
easyengine 的这篇博客介绍的比较详细:
wget https://github.com/rtCamp/httperf/archive/master.zip
unzip master.zip
cd httperf-master
yum install autoconf automake m4 libtool gcc make
autoreconf -i
mkdir build
cd build
../configure
make
make install
如果没有安装 automake 和 libtool 会出现下面的情况:
aclocal  not found
error: possibly undefined macro: AC_PROG_LIBTOOL
以固定速率发送请求
以每秒钟 10 个的速率发送 100 个请求,默认一个连接只发送一个请求:
$ httperf --server www.baidu.com --port 80 --num-conns 100 --rate 10
Total: connections 100 requests 100 replies 100 test-duration 9.916 s

Connection rate: 10.1 conn/s (99.2 ms/conn, <=1 concurrent connections)
Connection time [ms]: min 13.6 avg 20.3 max 52.2 median 17.5 stddev 7.0
Connection time [ms]: connect 8.3
Connection length [replies/conn]: 1.000

Request rate: 10.1 req/s (99.2 ms/req)
Request size [B]: 75.0

Reply rate [replies/s]: min 10.0 avg 10.0 max 10.0 stddev 0.0 (1 samples)
Reply time [ms]: response 12.0 transfer 0.0
Reply size [B]: header 186.0 content 386.0 footer 0.0 (total 572.0)
Reply status: 1xx=0 2xx=100 3xx=0 4xx=0 5xx=0

CPU time [s]: user 4.65 system 5.22 (user 46.9% system 52.6% total 99.5%)
Net I/O: 6.4 KB/s (0.1*10^6 bps)

Errors: total 0 client-timo 0 socket-timo 0 connrefused 0 connreset 0
Errors: fd-unavail 0 addrunavail 0 ftab-full 0 other 0
可以得到连接的信息和响应的信息。
Sessions:模拟用户会话
--wsess=N1,N2,X 指定 Session 设置, N1 是要是生成的 Session 的总数,N2 是每个 Session 包含的请求数,X 是用户的思考时间,即停顿时长。
--burst-len 指定每个批次发送的请求数量。
--wsess=100,50,10 --burst-len 5 意思是:总共建立 100 个会话,每个会话累计发送 100 个请求,停顿时间是 10 秒,每批次发送 5 个请求。
在每个会话中:
- 是先发送一个请求,得到回应后,再并发发送一个批次的请求;
- 如果服务端的第一个回应设置设置 keep-alive ,复用当前连接,否则新建连接发送;
- 停顿时间是从收到上个批次的最后一个回应开始计算的。
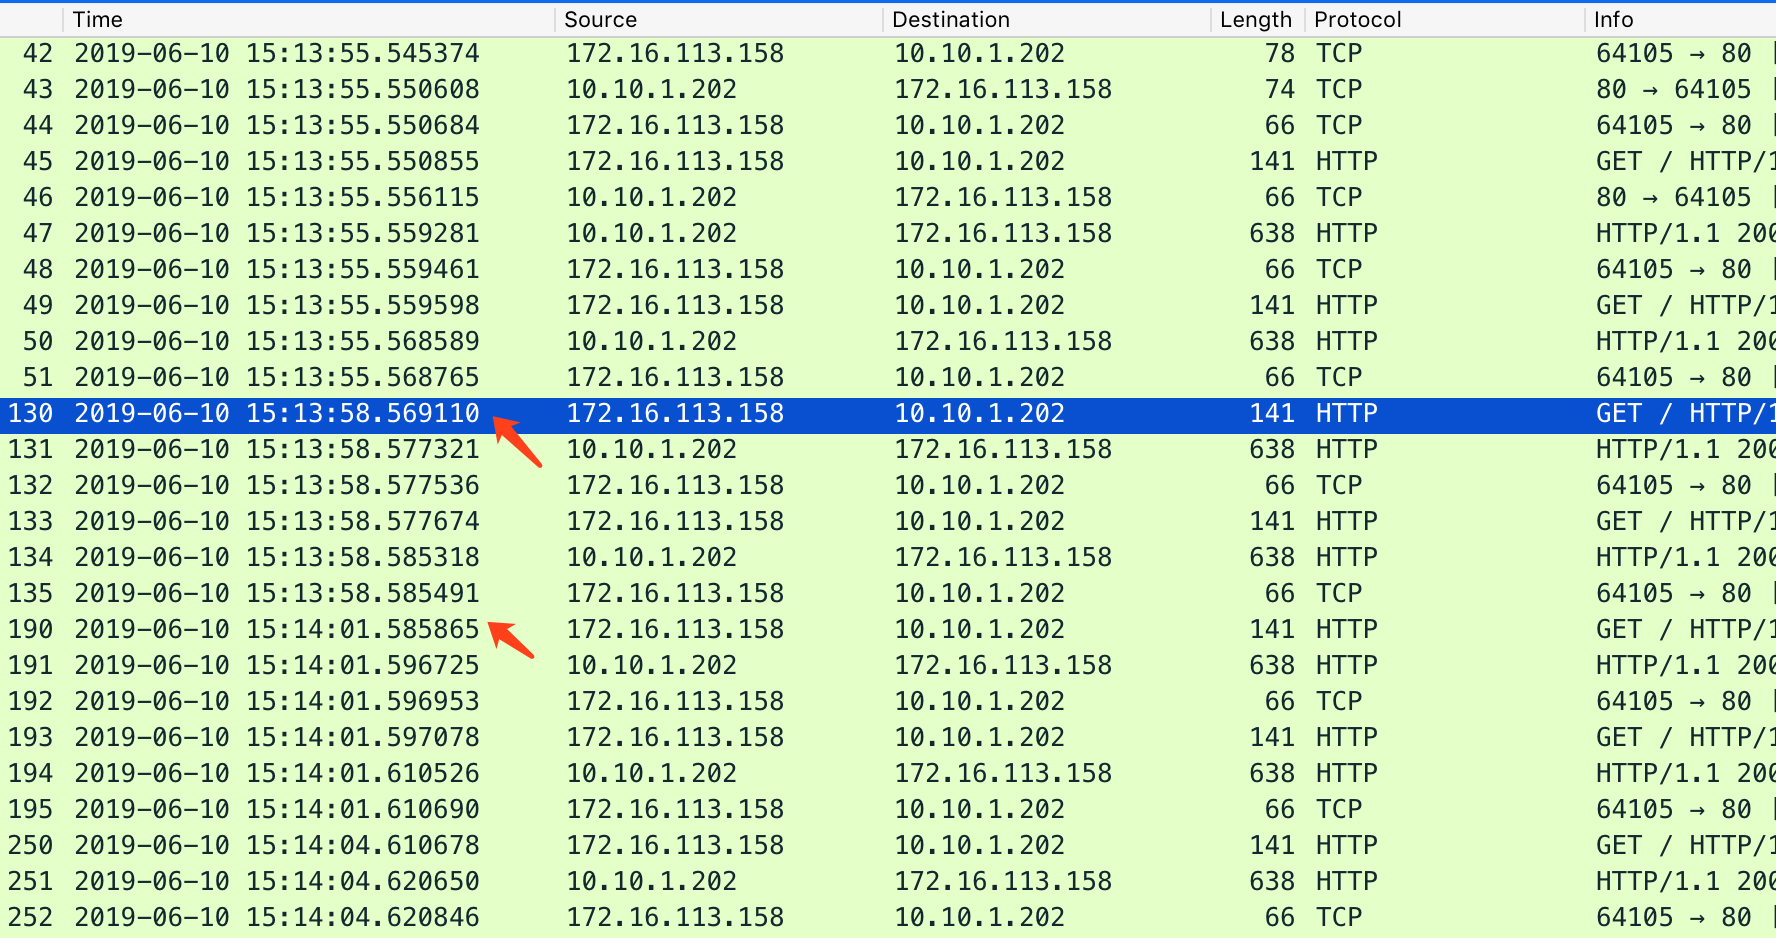
下面的命令以每秒 10 个的速率总共建立 10 个 session,每个 session 中发送 10 个请求,每批次发送 2 个,批次间间隔 3 秒:
httperf --server webshell.paastest.test --port 80 --wsess 10,10,3 --burst-len 2 --rate 10
用 wireshark 抓包可以看到下面的情形:
ApacheBench
ApacheBench 的测试结果中包括每秒钟的请求次数、请求的处理时间分布、请求的平均耗时、传输的数据量,以及连接建立、处理过程的时间分布,信息比较详细。
yum install httpd-tools
下面是 ab 的测试输出:
[root@lab ~]# ab -n 5000 -c 500 http://localhost:80/
This is ApacheBench, Version 2.3 <$Revision: 655654 $>
Copyright 1996 Adam Twiss, Zeus Technology Ltd, http://www.zeustech.net/
Licensed to The Apache Software Foundation, http://www.apache.org/
Benchmarking localhost (be patient)
Completed 500 requests
Completed 1000 requests
Completed 1500 requests
Completed 2000 requests
Completed 2500 requests
Completed 3000 requests
Completed 3500 requests
Completed 4000 requests
Completed 4500 requests
Completed 5000 requests
Finished 5000 requests
Server Software:        Apache/2.2.15
Server Hostname:        localhost
Server Port:            80
Document Path:          /
Document Length:        4961 bytes
Concurrency Level:      500
Time taken for tests:   13.389 seconds
Complete requests:      5000
Failed requests:        0
Write errors:           0
Non-2xx responses:      5058
Total transferred:      26094222 bytes
HTML transferred:       25092738 bytes
Requests per second:    373.45 [#/sec] (mean)
Time per request:       1338.866 [ms] (mean)
Time per request:       2.678 [ms] (mean, across all concurrent requests)
Transfer rate:          1903.30 [Kbytes/sec] received
Connection Times (ms)
min  mean[+/-sd] median   max
Connect:        0   42  20.8     41    1000
Processing:     0  428 2116.5     65   13310
Waiting:        0  416 2117.7     55   13303
Total:         51  470 2121.0    102   13378
Percentage of the requests served within a certain time (ms)
50%    102
66%    117
75%    130
80%    132
90%    149
95%    255
98%  13377
99%  13378
100%  13378 (longest request)
ab 不支持 http 1.1,如果要测试 http1.1,可以使用 siege 或者 apib 等。
siege
siege 安装:
yum install -y siege
siege 的配置参数可以通过 siege -C 看到,配置项保存在 $HOME/.siege/siege.conf 中,比较常用的有:
protocol = HTTP/1.1      # 配置使用的协议
connection = keep-alive  # 使用长链接
concurrent = 25          # 并发数量,可以用命令行参数-c覆盖
timeout = 600            # 链接超时时间
verbose = false          # 不显示每个请求
failures =  1024         # 可以容忍的失败数
另外 siege 还有一些命令行参数,命令行参数优先于配置文件中的设置:
[[email protected] vagrant]# siege -h
SIEGE 4.0.2
Usage: siege [options]
       siege [options] URL
       siege -g URL
Options:
  -V, --version             VERSION, prints the version number.
  -h, --help                HELP, prints this section.
  -C, --config              CONFIGURATION, show the current config.
  -v, --verbose             VERBOSE, prints notification to screen.
  -q, --quiet               QUIET turns verbose off and suppresses output.
  -g, --get                 GET, pull down HTTP headers and display the
                            transaction. Great for application debugging.
  -c, --concurrent=NUM      CONCURRENT users, default is 10
  -r, --reps=NUM            REPS, number of times to run the test.
  -t, --time=NUMm           TIMED testing where "m" is modifier S, M, or H
                            ex: --time=1H, one hour test.
  -d, --delay=NUM           Time DELAY, random delay before each requst
  -b, --benchmark           BENCHMARK: no delays between requests.
  -i, --internet            INTERNET user simulation, hits URLs randomly.
  -f, --file=FILE           FILE, select a specific URLS FILE.
  -R, --rc=FILE             RC, specify an siegerc file
  -l, --log[=FILE]          LOG to FILE. If FILE is not specified, the
                            default is used: PREFIX/var/siege.log
  -m, --mark="text"         MARK, mark the log file with a string.
                            between .001 and NUM. (NOT COUNTED IN STATS)
  -H, --header="text"       Add a header to request (can be many)
  -A, --user-agent="text"   Sets User-Agent in request
  -T, --content-type="text" Sets Content-Type in request
siege 的设计思路和 ab 是反的,ab是指定并发数和总的请求数,运行完所有请求后,统计时间,siege 是指定并发数和运行时间,统计这段时间内完成的请求数。
例如下面是用 10 个并发,进行一分钟的 benchmark 测试,参数 -b 表示使用 benchmark 的方式:
$ siege -c 10 -b -t 1M -H "host: echo.com"  192.168.33.12:8000
** SIEGE 4.0.2
** Preparing 10 concurrent users for battle.
The server is now under siege...

Transactions:		      102797 hits
Availability:		       99.01 %
Elapsed time:		       28.07 secs
Data transferred:	       61.37 MB
Response time:		        0.00 secs
Transaction rate:	     3662.17 trans/sec
Throughput:		        2.19 MB/sec
Concurrency:		        9.71
Successful transactions:      102797
Failed transactions:	        1024
Longest transaction:	        0.03
Shortest transaction:	        0.00
遇到的问题
siege压测时遇到一个问题:
[[email protected] vagrant]# siege -q -c 10 -b -t 10s -H "host: echo.com"  192.168.33.12:7000
[error] socket: read error Connection reset by peer sock.c:539: Connection reset by peer
[error] socket: read error Connection reset by peer sock.c:539: Connection reset by peer
siege aborted due to excessive socket failure; you can change the failure threshold in $HOME/.siegerc
可以修改 $HOME/.siege/siege.conf 中的配置,增加容忍的失败数:
failures = 1024 # 可以容忍的失败数
把 failures 调高,是治标不治本的做法,还要找到被 reset 的原因,但是在 nginx 日志和 dmesg 中都没有找到日志,access.log 中的请求日志全部是成功的。
从 Tuning NGINX for Performance 知道了 keepalive_requests,这个参数限制了一个 keep-alive 连接中可以发起的请求的数量,调大即可:
server {
    listen       7000 ;
    listen       [::]:7000 ;
    server_name  echo.com;                         # 在本地host配置域名
    keepalive_requests  10000000;

    location / {
      proxy_pass http://172.16.128.20:8080;
    }
}
资源测量工具
性能分析工具
用火焰图进行性能分析的案例: Web开发平台OpenResty(三):火焰图性能分析。
参考

推荐阅读
Copyright @2011-2019 All rights reserved. 转载请添加原文连接,合作请加微信lijiaocn或者发送邮件: [email protected],备注网站合作
友情链接: Some Online Tools Develop by Me 系统软件 程序语言 运营经验 水库文集 网络课程 微信网文